Search: Digital Future

Sunday, 19 June 2011

Dell Swarm - The First & Most Successful Corporate Group Buying Platform

Last week I did a joint presentation with Euan Wilcox, Regional Managing Partner from The Upper Storey (the digital agency that both Dell and Intel have been working with on Dell Swarm since the beginning) on the state of Group Buying and Social Commerce. The key highlight was discussing the next phase in the evolution of Dell Swarm, Dell's group buying e-commerce platform.

Dell Swarm (Australia) - http://www.dellswarm.com/
Originally conceived as an Intel and Dell joint marketing effort, Dell Swarm was launched in Singapore in May 2009. As a marketing tool, it generated a lot of buzz but it wasn't the commercial success Dell was looking for. It evolved again and was re-released in Canada and more recently Australia. Each time, the Dell Swarm platform has evolved and improved.

This year, Dell Swarm has just launched in the UK, is going into a new version in Australia and will be launched in Singapore, Malaysia and Brazil in the next 2 months, and in other countries like Japan and China later this year.

What is remarkable about this is that Dell Swarm is the world's first corporate group buying / deal of the day / social commerce platform developed by a fortune 500 company. It's an incredibly bold move by Dell. However, when you consider Dell's amazing heritage in e-commerce it doesn't seem as surprising. For example Dell was:
  • The fist company to sell complex configurable items via e-commerce
  • The first company to reach US$1M a day in online revenue
  • One of the first to launch discussion forums (back in 1995)
  • One of the first to have online support / e-support
And now it is the first company to develop a group buying platform.

Here is a great video on how the Dell Swarm group buying platform works: . You can also find out more on Dell Swarm at: http://www.dellswarm.com/.

I'd love to hear your feedback on Dell Swarm as I'm globally leading the program (and I consider it my "baby"). Thanks!

Monday, 6 June 2011

The Rise of LinkedIn (Infographic)

Here's a great article (via Mashable) that presents a wonderful infographic (via OnlineMBA) on the rise of LinkedIn. LinkedIn recently passed 100 million users, meaning its population is bigger than most countries. But what kind of country would LinkedInLand be? An old, rich, well-educated one.

According to the infographic below, created by Online MBA, 68% of LinkedIn users are 35 or older, 74% have a college degree or better and 39% make more than $100,000 a year. As those stats illustrate, although LinkedIn may not have the buzz of Facebook or Twitter right now, it has an enviable demographic base. The company also is profitable, fast-growing and expanding into new lines of business like news aggregation. As LinkedIn prepares to go public this year, here’s an overview of the phenomenon that Reid Hoffman created 8 years ago.

Thursday, 2 June 2011

China Social Media Landscape - Infographic

Here's a great infographic from CIC on the Chinese social media landscape. It's 2010 data and a lot has happened in a year but it's excellent for identifying trends and the big players.

Thursday, 13 January 2011

Shifting Twitter Trending Topics From 2009 - 2010

Here's a year-to-year trend from 2009 to 2010 in the changes in Twitter trending topics. This data first appear on Ad Age and was compiled by trend tracking company What The Trend.

In Simon Dumenco's Ad Age article, he summed up the changes as: "In essence, Twitterers seem more and more interested in entertaining themselves and each other with hashtag musings than tweeting about commercially-produced entertainment."


Tuesday, 11 January 2011

Seven Top Online Marketing Trends for 2011

Heidi Cohen ClickZ.com January 10, 2011

Here are the seven top online marketing trends.

1. Social media marketing goes mainstream. In 2010, corporate use of social media reached a tipping point. Companies will become more sophisticated in their social media marketing usage as they get more experienced. As part of this evolution, social media will extend throughout organizations, namely customer service. Further, social media advertising will come into its own and yield relatively stronger results as happens with any new advertising platform. It's also largely attributable to the ability to tightly target audiences based on social media activity.

The one challenge to this progress will be Facebook, Twitter, and Groupon's high market valuations, potentially signaling a bubble.

2. Mobile hits its stride. While U.S. mobile expansion has been on everyone's list for many years, 2011 will pave the way for a number of important marketing changes. Fueled by high smartphone adoption that continues to expand and an increasing percentage of mobile-only households, the U.S. is poised for enhanced mobile marketing. Recent Nielsen data shows that 30 percent of cell phones are smartphones and BlackBerries account for about a quarter of smartphones.

Source: The Nielsen Company

Along with on-the-go consumption, e-mail remains the dominant mobile activity. Further, app users have downloaded an average of 27 apps.


Source: The Nielsen Company

Based on this growth, Forrester forecasts that over 75 percent of marketers plan to include mobile in their marketing mix. Given mobile e-mail's strength and average app downloads, focus on mobile interactive extension to meet users needs on the go. Think bite-size consumption and mobile findability (aka search). As a result, location-based services (aka LBS) such as Foursquare with competition from giants like Facebook will continue to expand their reach.


QR codes and mobile payments will also grow.

3. Content marketing expands in new venues. Other forms of portable devices, namely e-readers and iPads, gain traction. Apple's iPad has sold 8.5 million units based on eMarketer's estimates.


While Amazon has sold 8 million* Kindles, its highest selling item to-date. This is good news for publishers who consider these devices paid content consumption nirvana. These devices require that marketers think about their target market's content consumption habits. Roughly two-thirds of consumers have paid for some form of online content according to Pew Research Center's Internet & American Life Project. Among the dominant forms of paid content were digital music, software, cell phone and tablet apps, digital games, news articles or reports, and videos, movies, or television shows. But, before publishers run to the bank, they must assess the average $47 content spend carefully because the typical customer only spends $10!

4. Marketing goes real-time, not just watching issues for PR and potential fires. (Hat tip to David Meerman Scott.) Marketers must be vigilant to take advantage of marketing opportunities while mitigating the impact of small fires (for example, Ford's use of social media to quell a PR fire). This requires a more flexible promotional and communications strategy. As a result, marketing needs to be agile because these events can't be planned six months in advance. Further, every firm must have a crisis management plan and vigilant monitoring.

5. Online retail continues to take market share from other channels. Christmas 2011 showed that consumers were willing to spend money, either due to pent up desire or as shopping therapy, despite the challenging financial outlook. Online holiday purchasing grew, taking share from brick-and-mortar retail, showing consumers' willingness to use and trust online payments. J.P. Morgan senior analyst Imran Kahn forecasts that U.S. online retail will continue to grow at a 12.4 percent CAGR (compound annual growth rate) from an estimated $166 billion in 2010 to $235 billion in 2013. While a very small percentage of holidays sales, social shopping will continue to expand its influence due to its ability to target and reach consumers early in the decision phase. Also, group buying via Groupon and its competitors will continue to be a growing trend as long as marketers can make money from these promotions.

6. Integrated marketing comes of age. As the big social media marketing campaigns of 2010, namely Pepsi Refresh and Old Spice, showed, integration across marketing platforms is a must! With expansion of social media marketing; mobile, e-reader, and offline marketing (remember, television still dominates!) all need to work together.

7. Metrics move into the spotlight for social media. Just as you do for traditional forms of marketing, as social media matures and invests real budget and headcount, management will require justification for these dollars. To this end, better social media metrics and a clear pathway to ROI is needed. Related to this is improved social monitoring to aid tracking. Further, marketers must incorporate calls-to-action and promotions to aid tracking.

As you plan for 2011, use these seven online marketing trends to guide your marketing initiatives. Bear in mind that to hit your 2011 goals, you need to have metrics including those for your social media and mobile strategies that help you achieve your corporate mission.

Tuesday, 14 December 2010

eMarketer Research Reveals Marketers Buy In to Promoted Tweets

This is a recent artcile found on eMarketer.

Twitter advertising is attracting more interest from marketers.

In November, the TWTRCON conference and oneforty, an online directory for Twitter tools, surveyed 110 business professionals, mostly from marketing and communications, about their interaction with Twitter’s Promoted Products suite.

Overall, the respondents were interested in using Twitter ads as a part of their marketing mix, with 51% of respondents somewhat or very interested in Promoted Products. However, 27% hadn’t made up their minds and 22% said they had no interest at all.


The survey also noted that many brands and marketers are waiting to see the return on investment and business effect of such programs before getting involved. Buying a Promoted Trend adds the brand or product to the top of Twitter’s Trends list; Promoted Tweets give prominent placement to tweets from the advertiser. A third ad format, Promoted Accounts, includes a branded account among the other accounts Twitter suggests a user should follow.

At the Web 2.0 Summit in San Francisco in November, Twitter co-founder Evan Williams said using Promoted Trends increased the conversation around a topic by three to six times, and that most advertisers return after they have tried the format. Recently, Radio Shack sponsored the Promoted Trend #IfIHadSuperPowers, and Pillsbury used Promoted Tweets to discuss holiday food and recipes.

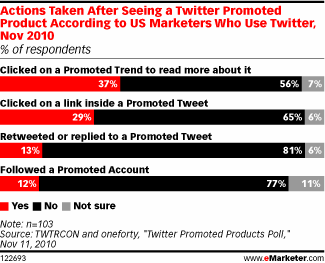
Twitter users are starting to take notice of the ads. The TWTRCON-oneforty survey found that 37% of respondents have clicked on a Promoted Trend and 29% clicked on a Promoted Tweet.


However, Twitter has a lot to do to catch up to other popular ad formats. Only 11% of the TWTRCON-oneforty study respondents said their organizations had used Twitter’s Promoted Products so far, while 59% were using Google AdWords and 55% used Facebook ads.

In a survey of ad agencies conducted in Q3 2010 by STRATA, 87.9% of respondents said they were likely to use Facebook advertising; less than half as many thought they would use Twitter ads.

Monday, 13 December 2010

Facebook Relationships Visualised

Here's a great image of Facebook's visualisation of its connected global relationships from Mashable.


Ben Parr's original Mashable article looks at how this social graph was put together:

Facebook Intern Paul Butler was interested in the locations of friendships, so he decided to create a visualization of Facebook connections around the globe. How local are our friends? Where are the highest concentration of friendships? How do political and geological boundaries affect them?

Butler started by using a sample of 10 million friend pairs, correlated them with their current cities and then mapped that data using the longitude and latitude of each city.

That was the easy part. Creating the right effect to show connecting relationships between thousands of cities proved to be a challenge. Butler wrote a fascinating Facebook note explaining some of the challenges he faced creating his visualization:

“I began exploring it in R, an open-source statistics environment. As a sanity check, I plotted points at some of the latitude and longitude coordinates. To my relief, what I saw was roughly an outline of the world. Next I erased the dots and plotted lines between the points. After a few minutes of rendering, a big white blob appeared in the center of the map. Some of the outer edges of the blob vaguely resembled the continents, but it was clear that I had too much data to get interesting results just by drawing lines. I thought that making the lines semi-transparent would do the trick, but I quickly realized that my graphing environment couldn’t handle enough shades of color for it to work the way I wanted.

Instead I found a way to simulate the effect I wanted. I defined weights for each pair of cities as a function of the Euclidean distance between them and the number of friends between them. Then I plotted lines between the pairs by weight, so that pairs of cities with the most friendships between them were drawn on top of the others. I used a color ramp from black to blue to white, with each line’s color depending on its weight. I also transformed some of the lines to wrap around the image, rather than spanning more than halfway around the world.”

With a few more tweaks, he eventually came up with the amazing visualization you see here. At first glance, it provides some expected data — the U.S. has the highest concentration of Facebook friendships, and Africa has the lowest concentration. While most of Russia and Antarctica are nowhere to be found, the rest of the world is easily identifiable.